 Who to be compared too
 Many dealers
have a mix of products and are therefore involved in several different types of industries. So when you want to compare
your performance, you can do that for part of your business or your whole business. Your industry key is
generated by looking at your mix of products. Some examples of how;
Many dealers
have a mix of products and are therefore involved in several different types of industries. So when you want to compare
your performance, you can do that for part of your business or your whole business. Your industry key is
generated by looking at your mix of products. Some examples of how;
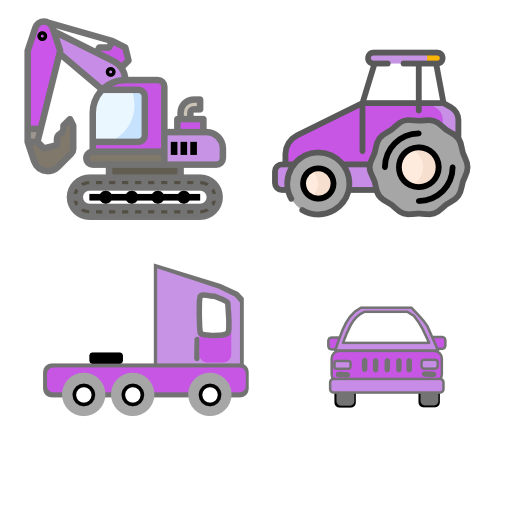
Cars(25%),Trucks(25%),Farming(25%),Construction(25%) generates
a profile like [Cons Farm Truck Cars]
Cars(10%),Trucks(40%),Farming(25%),Construction(25%) generates
a profile like [Truck Cons Farm]
Cars(10%),Trucks(65%),Farming(15%),Construction(10%) generates
a profile like [Truck Farm]
 Similarly, your
type of business impacts financial and operational performance. We look at three types of business; importer,
wholesale, and dealer. To be able to compare to peers, you need to define your role in the value chain:
Similarly, your
type of business impacts financial and operational performance. We look at three types of business; importer,
wholesale, and dealer. To be able to compare to peers, you need to define your role in the value chain:
The importer's role usually is the role of holding the country's (or regional)
stock of units and parts. It could be an exclusive or non-exclusive contract with the manufacturer. The dealership is
then selling these products to the end user.
From the manufacturers' perspective, the wholesale role is the same as the
importer. But here, the dealership is instead selling the products to a network of dealers interacting with the end user.
The dealer's role is buying units and/or parts from an importer or wholesale
dealer and then offering these to the end users. The business agreements are normally not signed by the manufacturer
but by the manufacturer's local partner (importer/wholesale). Still, the dealership is an official partner and might
have access to manufacturers' systems
As a user, you can also define if you want to benchmark within your country,
with other dealerships within your regional area, or with all dealerships globally.
As a user you can also define if you want to benchmark within your country,
with other dealerships within your regional area, or with all dealerships globally.
The area is set by the system depending on the country of the dealership.
The continental regions are OCEANIA, SOUTH EAST ASIA, EAST ASIA, SOUTH ASIA, CIS COUNTRIES (EX RUS), MIDDLE EAST,
EAST EUROPE, WEST EUROPE, NORTH AFRICA, SUB SAHARA AFRICA, NORTH AMERICA, CARIBBEAN and SOUTH AMERICA..